Home » Climate Change » Fact Checker uses Bad Math or Maybe I Did?

Fact Checker uses Bad Math or Maybe I Did?

     I know I keep going back to that John Stossel video where he is trying to find out why one of his earlier Climate videos on Facebook got …??? devalued may be the right word, after a fact check.
    So in reaching out to the Fact Check group, he speaks with Patrick Brown from San Jose State University at the time. Who didn’t like John showing other scientists who are not panicked by the sea level rise? When pressed Patrick claims that the seas will rise 200 feet in the next 1000 years and we all should be alarmed. I did that math 200 feet x 12 inches/ft ÷ 1000 yrs. = 2.4 inches p/yr

     I know it is tougher and tougher to do a Google search and get results that aren’t government approved and all I got today on the first page was predictions from NOAA & NASA all outrageous. Looks like the government is going pedal to the metal with the scare campaigns we are suddenly going from 2-3 MILLIMETERS p/yr to 6-8 inches in the next 30 years!!??
So I went to historic records and found graphs going back 100 plus years so you could see that sea level rise has been and still is a steady number.

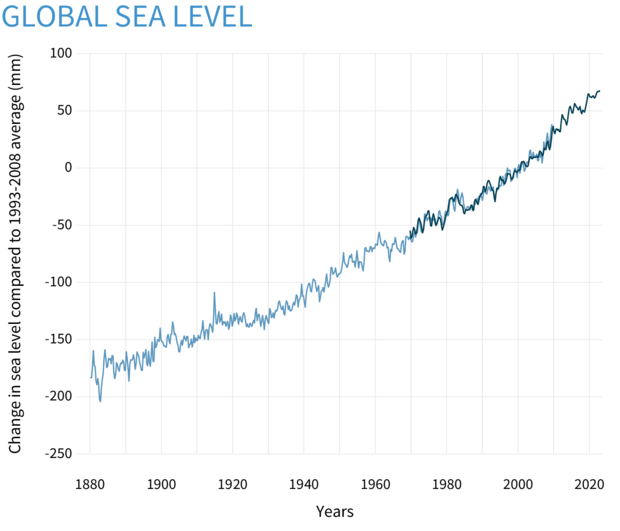
Here is a link to that NOAA page for you to read yourself

     They like to take a small sample that is most beneficial to their fear/propaganda campaign and then extrapolate that out. For example, if I tell or show you how much colder it got from Nov 25 to Dec 25th then multiply that by 32 months you’ll think it is going to be over 100 below zero!!! unless you realize 32 months later will be July and it will still be 90 degrees or so as always 🙂
     That article was a little hard to get through the predictions based on if this or that happens but I was able to find one paragraph that gives a short version and they are speaking in terms of millimeters and a rise of 1 foot a century( yrs 2000 – 2100 ) not 10 feet per century like Professor Brown was calculating.
The global mean water level in the ocean rose by 0.14 inches (3.6 millimeters) per year from 2006–2015, which was 2.5 times the average rate of 0.06 inches
(1.4 millimeters) per year throughout most of the twentieth century. By the end of the century, global mean sea level is likely to rise at least one foot (0.3 meters)
above 2000 levels

Read More Climate Change Posts Here>>>
Also feel free to visit my X/twitter Page Here>>> or my Youtube Channel Here>>>
Feel Free to Share & Like: